

Deconstructing Alpha
Diclaimer: This is not investment advice. For the love of God Timmy, sit back down and shut up before you “inform” me about past returns.
As we’ve seen before, MTG’s best performing set, Alpha, really demolished the indexes. However, not every card is created equal; some are more rare and desirable then others.
What you’re looking at on the left is a pristine copy of Alpha’s most prized card, the Black Lotus.
This was worth $15 back in 1994 and now, depending on the condition of the card, can fetch well above $100000. That’s a 6500x return! Also interesting to note it’s worth almost 300x the lowest value rares from the same set, despite them being just as scarce as the Lotus.
How do these returns compare to the other cards in the set? Was it smarter to invest all your money into high end stuff or go for the “penny” stock of common cards?
Rare cards were printed at about 1000 copies, uncommon cards about 4500 and commons 16000. These are known print runs from early WOTC employees.
I removed the first freak years of MTG ( 1993-1995 ) where Alpha as a whole enjoyed a 400% return, with Black Lotus at 1666%, going from $15 to $250. If you include those years then Black Lotus completely demolishes everything else extremely badly but those are Bitcoin levels of cherry-picking, the odds you would have held onto a Black Lotus since 1994 are basically zero. Maybe 50 people in the world did this.


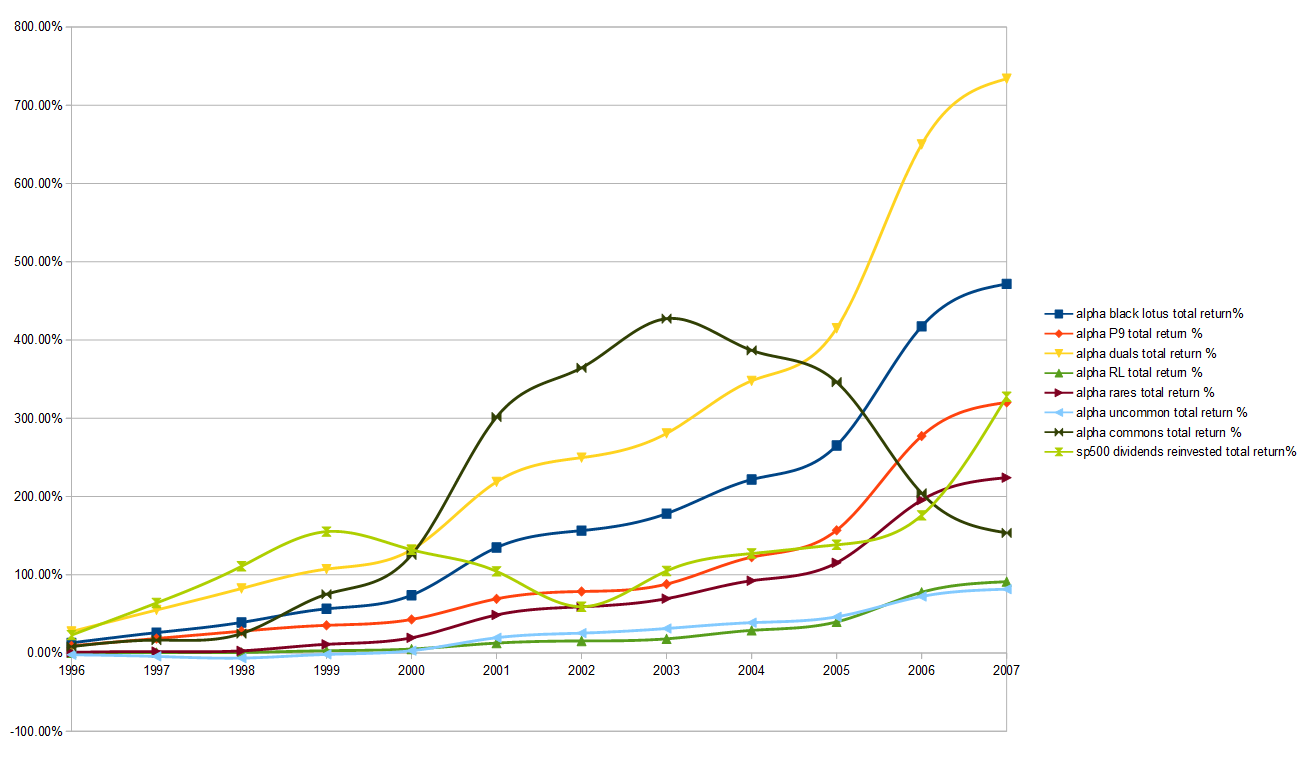
I’ll assume if you’re reading this I don’t need to explain what these categories are. Just note the categories are not inclusive, i.e. the P9 category does NOT contain the Black Lotus, the RL does NOT contain the P9/Duals and the rares contain just the rest ( no lotus, no p9, no duals, no RL ).
This paints quite a clear picture: Black Lotus and Duals absolutely took a crap on everything else. I’m assuming part of the reason is that Dual lands are played as multiple in people’s deck and played in many more formats where Black Lotus is banned ( because it’s a dumb broken card that makes no sense if you’re reading this and aren’t in the know ). Also interesting to see the non-RL rares beat out RL rares. Mainly due to cards like Shivan Dragon and Birds of Paradise which are highly sought after despite endless reprints.
Now how about we just look at the first 10 years:
The Dual Lands did extremely well and the non-lotus P9 didn’t even beat the index, let alone the rest of Alpha. That’s a little strange. Note that for a large portion of this time period, Alpha wasn’t as desirable as Beta because of the larger corners.
Ok now let’s look at the latest period:

Woah! What happened? Now every category has pulled ahead of the index! Ever stranger: All the rares ( except lotus ) are now clumped together very closely, meaning whether you dumped 50$ on some random Lace or 1200$ on a Mox, you did about as well. Uncommons now pull quite far ahead of the index and commons barely inch above.
Now lastly, what if we isolate “The Rudy Bump”, i.e the period after 2016, when Alpha Investments started his Youtube channel and ( I believe ) drove the MTG vintage market into a frenzy:

Woah! What the hell happened here? Uncommonsnow on top? Duals and Lotus at the bottom?? The complete reverse of the first 10 years. Caveat: The data from 2022 is from MTGoldfish while the data from 2023 is from Cardkingdom. The reason being that it reflects prices better, especially for low-end / undesirable stuff ( Ice Age reserved list ). But doing this, Alpha actually gets a price bump, especially the uncommons. For some reason. Caveat2: An Alpha Lotus is now an extremely rare and pricey card that would have massive price variance based on quality and random time of sale. One day it might sell for 100k and the next week 150k. Who knows at this point.
Conclusion? I have no idea.
What if we compare the price to the print ratio? So the total price of all alpha rares divided by the price of all commons and compare that to the relative rarity from the print run?
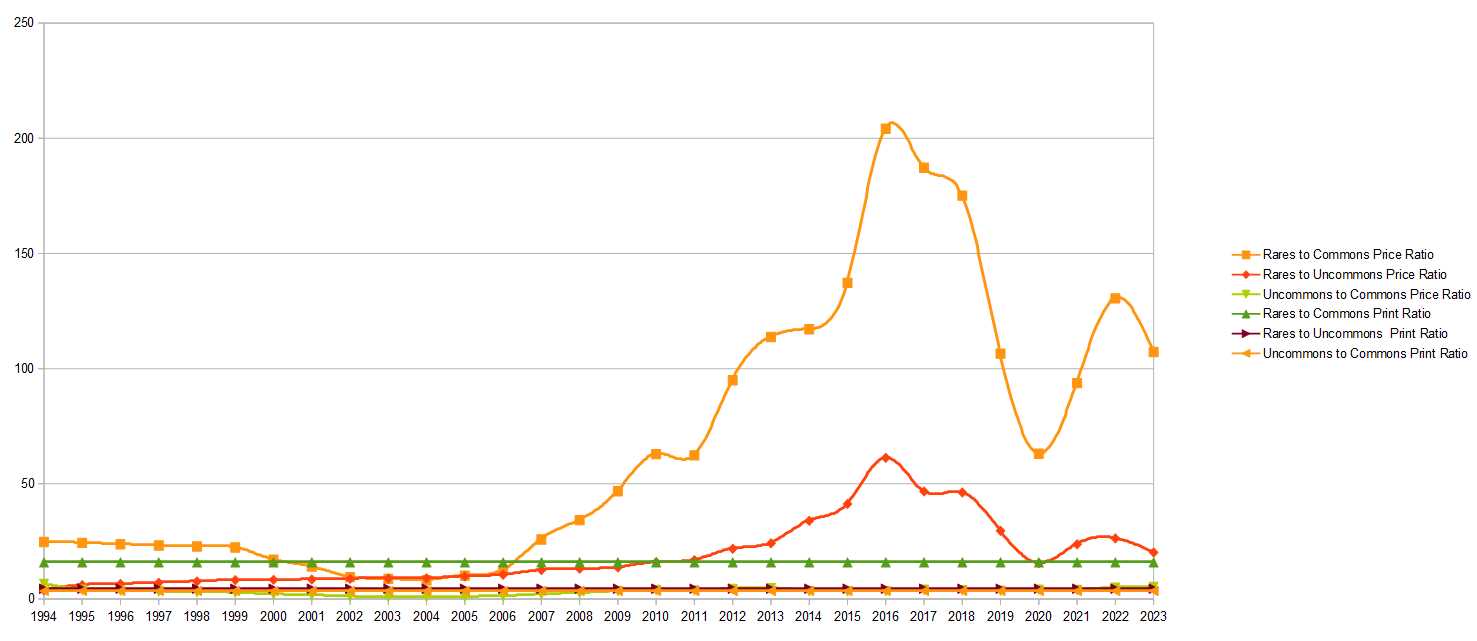
One thing is immediately clear here: The price of rares as a whole is very decoupled from the print run except for the early years with the crappy Scrye data that didn’t accurately reflect selling prices that well. In the post-Ebay / internet era we see the real demand for Alpha relative to the C/U skyrocket.
But then look at the interesting correction after Rudy comes along. Huh? My best guess is basically that everyone rushed to buy ANY Alpha that they could afford and this closed the gap.
However the interesting thing to note here is that the price of Uncommons vs Commons seems to basically respect the print ratio of 3.5:1 whereas Alpha is at over 100:1 when the print run was just 16:1.
Is this some hint that the Uncommons are undervalued somehow?
What to do with this information? I have no idea.
One factor not reflected here is the time / liquidity aspect as well. Buying/selling just one NM Alpha rare vs 100 beat-up Alpha commons, even if the value is the same, is quite different. It’s likely better to just own the one card, but it does open you to tax liabilities and much higher transaction costs ( like through ebay/heritage or even having to travel to do a deal in person ).
Source/ Method for the MTG data: https://www.thepoxbox.com/posts/whats-my-card-worth
Other MTG related content:
Should I buy this collectible? - Another flowchart for Timmy
Investing in Collectibles - Is it dumb? - Initial look at the suspiciously high ROI of MTG
What’s a fair comparison? - Trying to fairly compare MTG to stocks
Omg should I grade this? - How rare is your card, really?
Magic Post-Covid market bloodbath - Coming off the 2021 cocaine high
Where do I sell my cards? - A flowchart for Timmy